Design Structure Overview#
The Echoshader class acts as the controller that handles user interactions through widgets, triggers the necessary data updates, and updates the view accordingly. It achieves this through the use of callbacks and stream methods provided by libraries like Holoviews and Panel.
There are 3 levels designed in the structure demonstrated below.
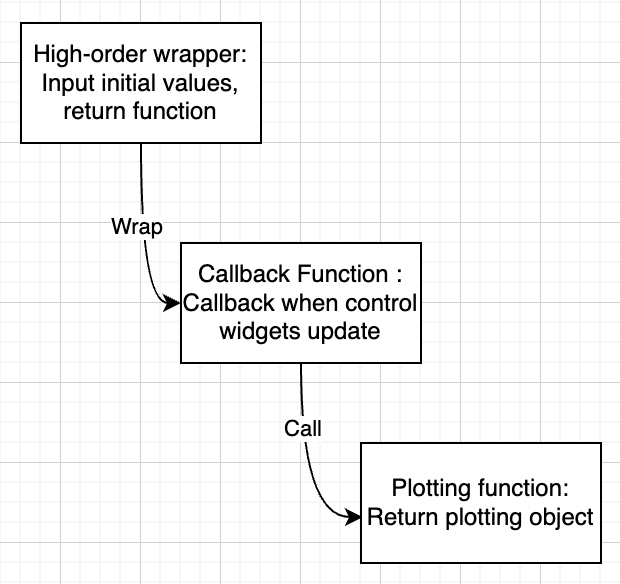
1st Level - High-order wrapper (Echoshader class)#
The Echoshader class serves as a comprehensive visualization toolset for analyzing acoustic data. It offers various visualization techniques such as echograms, tracks, curtains, histograms, and tables. Users can interactively explore the data by controlling parameters via interactive widgets.
Class Definition and Initialization#
The
Echoshaderclass is defined, inheriting fromparam.Parameterized, enabling easy integration of interactive parameters.The constructor (
__init__) initializes the instance and sets up initial values for parameters.The
_init_widgetmethod creates interactive widgets that control visualization parameters.The
_init_parammethod initializes additional parameters and streams required for visualization updates.
Visualization Methods#
Methods are defined to generate different types of plots: echograms, tracks, curtains, histograms, and tables.
These methods accept parameters that determine the plot’s appearance and data selection.
The
param.dependsdecorator is used to specify dependencies on widget values and other parameters.These methods internally invoke helper functions that create the actual visualizations.
Callbacks and Streams#
Callback methods are defined, such as
_update_gram_box, triggered when gram box bounds change.Stream objects (e.g.,
holoviews.streams.BoundsXYand custombox_stream) connect user interactions to callbacks.Streams trigger callback methods when users interact with the visualization (e.g., selecting a box).
Data Retrieval#
A method
get_data_from_boxretrieves data selected by a box in the visualization.
2nd Level - Callback Functions (Decorators and Stream Methods)#
Decorators and stream methods are used to create callbacks that update plots when widget values or parameters change.
For example,
_update_gram_boxis a callback method triggered when gram box bounds update.Stream objects facilitate user interactions by invoking corresponding callback methods.
3rd Level - Plotting Functions#
Functions (
_echogram_plot,_tricolor_echogram_plot,_track_plot,_tile_plot,_curtain_plot,_hist_plot,_table_plot) generate specific types of plots.These functions are called within
Echoshaderclass methods to create actual visualizations.Libraries like Holoviews and Panel are used to generate and display plots.
Customization options and parameters are available for the generated plots.
Xarray Extensions Using Accessors#
Extending xarray using accessors refers to the process of adding custom functionality and methods to xarray objects by creating and registering custom accessors.
This approach is particularly useful when we have domain-specific operations or manipulations that apply to xarray objects without cluttering your code with custom functions. It keeps code modular, maintainable, and helps leverage the power of xarray for your specific use case.
We write a custom “eshader” accessor. You could use accessor to get echograms
MVBS_ds.eshader.echogram()
Or you could just create a new echoshader object
eg = Echogram(MVBS_ds)
eg.echogram()